This post is a brief introfuction of Random Forest.
Introduction
This section gives a brief overview of random forests and some comments about the features of the method.
Ensemble Learning
In statistics and machine learning, ensemble methods use multiple learning algorithms to obtain better predictive performance than could be obtained from any of the constituent learning algorithms alone. Unlike a statistical ensemble in statistical mechanics, which is usually infinite, a machine learning ensemble consists of only a concrete finite set of alternative models, but typically allows for much more flexible structure to exist among those alternatives.
Two major barnces of ensemble learning
1.Boosting
Typical algorithm-AdaBoost
2.Bagging
Typical algorithm–Random forest.
Thinking of bagging
由于是多棵树,因此可以解决决策树泛化能力弱的缺点.
Example
Description:How to use random forest to predict the income of a person based on the age, gender, higest educational qulifacation, industry and residence.(The country in this example is Mexico)
Salary bands :
Band 1 : Below $40,000
Band 2: $40,000 – 150,000
Band 3: More than $150,000
Mexico has a population of 118 MM. Say, the algorithm Random forest picks up 10k observation with only one variable (for simplicity) to build each CART model. In total, we are looking at 5 CART model being built with different variables. In a real life problem, you will have more number of population sample and different combinations of input variables. Following are the outputs of the 5 different CART model.
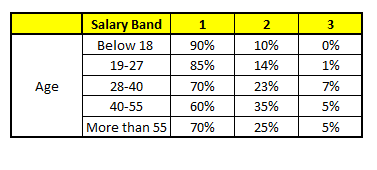
CART 1:Variable Age
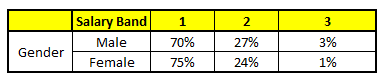
CART 2 : Variable Gender
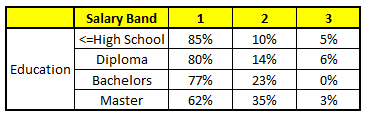
CART 3 : Variable Education
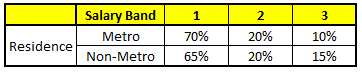
CART 4 : Variable Residence
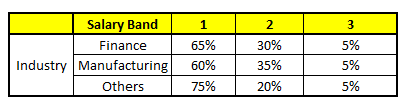
CART 5 : Variable Industry
the following profile in each CART model :
- Age : 35 years , 2, Gender : Male , 3. Highest Educational Qualification : Diploma holder, 4. Industry : Manufacturing, 5. Residence : Metro
For each of these CART model, following is the distribution across salary bands :
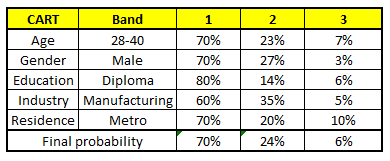
The final probability is simply the average of the probability in the same salary bands in different CART models. As you can see from this analysis, that there is 70% chance of this individual falling in class 1 (less than $40,000) and around 24% chance of the individual falling in class 2.